
A Simple Looker Marketing Report For The People
Making marketing decisions with no data costs everything
If you have the choice to make marketing decisions with or without data, you'd choose the former every time, right? Of course, but you'd be surprised how few businesses we speak to use data to inform decisions or measure their marketing.
Making decisions on where to spend marketing resources based on a whim costs money and time. It's easy to spend time putting together a Google Ads campaign for an audience because it feels right, but the reality is that you might already rank really well for those search queries organically. That's time and money wasted. Or, you could be spending money every month on Meta Ads with a full suite of ads, but only one of them is generating conversions. Without that knowledge, money is wasted and time isn't optimised.
It's not a lack of desire, it's the cost of time and energy
Making marketing decisions with no data isn't for lack of desire, it's often because it takes time to understand and read data and have the confidence to know what you're looking at is telling you the right story. It's also difficult to even know where to look, whether it be in Google Analytics, Google Search Console, Meta Business Manager etc. Above all, it's the time needed to do all of the above; learn, find, interpret.
For example, understanding website traffic behaviour takes years of practice with Google Analytics, knowing where to find key reports, understanding the definition of dimensions and metrics, and using secondary dimensions and filters to drill down to insightful information. Even after this, it's knowing how to interpret data and tell a wider and actionable story.
Ross is our data and tracking specialist, with a decade and a half of experience in measuring and interpreting client data in his client's language.
Another example is simply understanding conversion on websites. To accurately understand how many users are submitting contact forms, it requires some configuration in Google Tag Manager (a Google tool, like Google Analytics, that allows you to embed tags and code without having to be a developer) and marking up of key events in Google Analytics. This also requires knowledge and experience to do properly, something that few business leaders have time or energy to do.
There's an answer to simple reporting
At Thunder & Flash Marketing, we get this and it's probably the most common thing we hear when we first speak with clients. At the very least, data is misinterpreted or only partially visible. We don't want to see this, we want everyone to understand the basic data that allows them to understand and interpret their website traffic.
That's why we've made a simple marketing report template that anyone can access, download and configure. Within 30 minutes you'll have what you need to get straightforward reporting on your website, it's performance in Google Search and Google Ads if you have them.
We call this ‘The Website Marketing Report For The People’.
What you'll need to get started:
- A computer
- Internet access
- A Google Account which also has:
- Admin access to your Google Analytics
If you need any help with this,
give us a call and we'll help for free!
Introducing The Website Marketing Report For The People… and its absolutely free!!
Tracking the right data and insights to make marketing decisions is imperative and potentially costly if done wrong. It takes knowledge and experience to do this accurately. However, we want to give everyone the chance to track the basics of website data with confidence. What's better: we won't charge you a penny for it!
Why are we doing this? We hope that if you ever need support with your marketing, you'll think of us and get in touch. Also, by arming you with knowledge opens doors for us: you get to see the gaps and Thunder & Flash Marketing is a possible solution. Put simply, we do this to start conversations. Either way, we get to give you something useful.
Getting Started
Step 1: Download your new Looker Report template
- Click this link: https://lookerstudio.google.com/reporting/142939f0-9c40-48ea-aa82-e1a72df869f1
- Click the three dots top right of the report and hit ‘Make a copy’

Step 2: Plug in your data to the Report
- You’ll then be asked to plug in your data (this is where you need to have admin access to your Google Analytics AND be logged into the same Google Account)
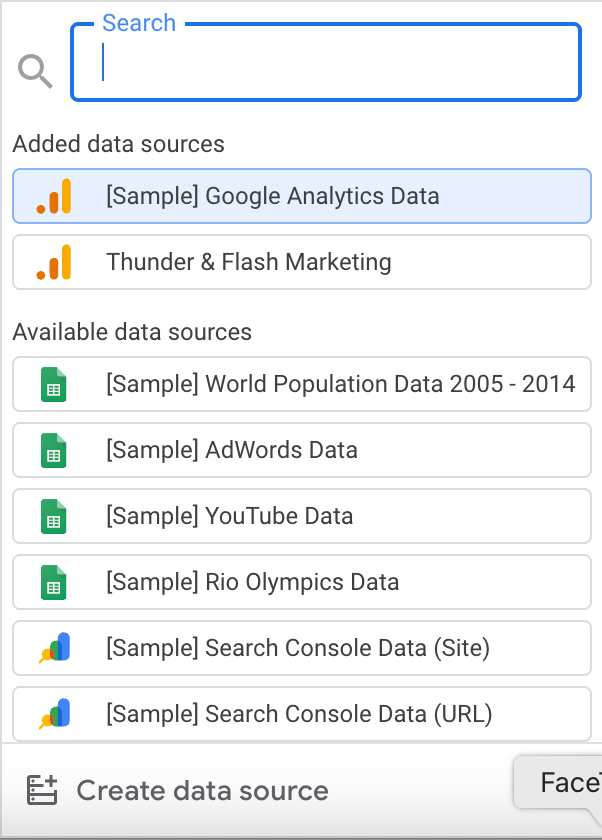
- Click the drop-down, where you’ll see the available data sources - you’ll need to click ‘Create data source’
- From here, select ‘Google Analytics’. If you don’t, search it in the search bar at the top.
- This will then open up a window which includes the available Google Analytics accounts and properties you have access to. Select the website account and property you’d like to connect to your new report.
- Make sure you select a GA4 property (if you still have an old UA property in your account list)
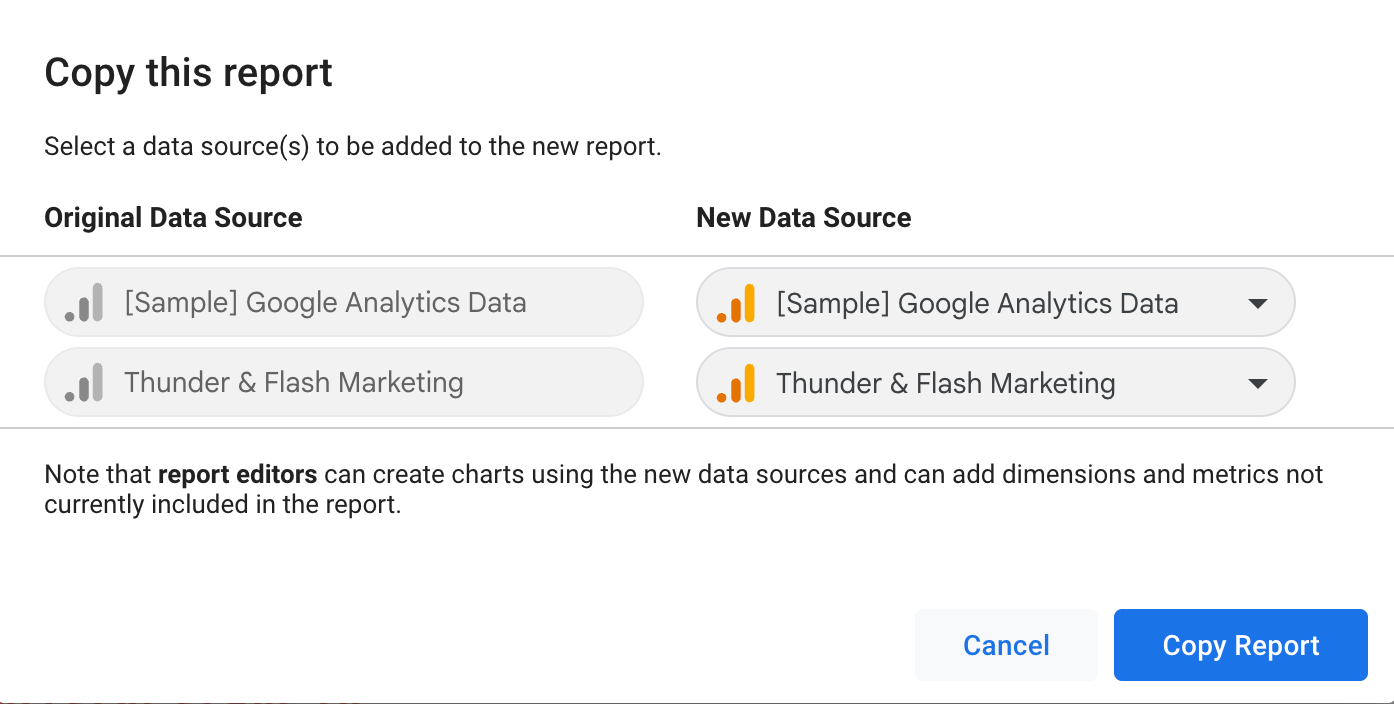
Step 3: Copy the report
- Once you’ve connected your data source, this will bring you back to the copy report window - click ‘Copy Report’
Congratulations! You're now a step closer to simple and straight to the point reporting!
Using Your New Report
Give it a name!
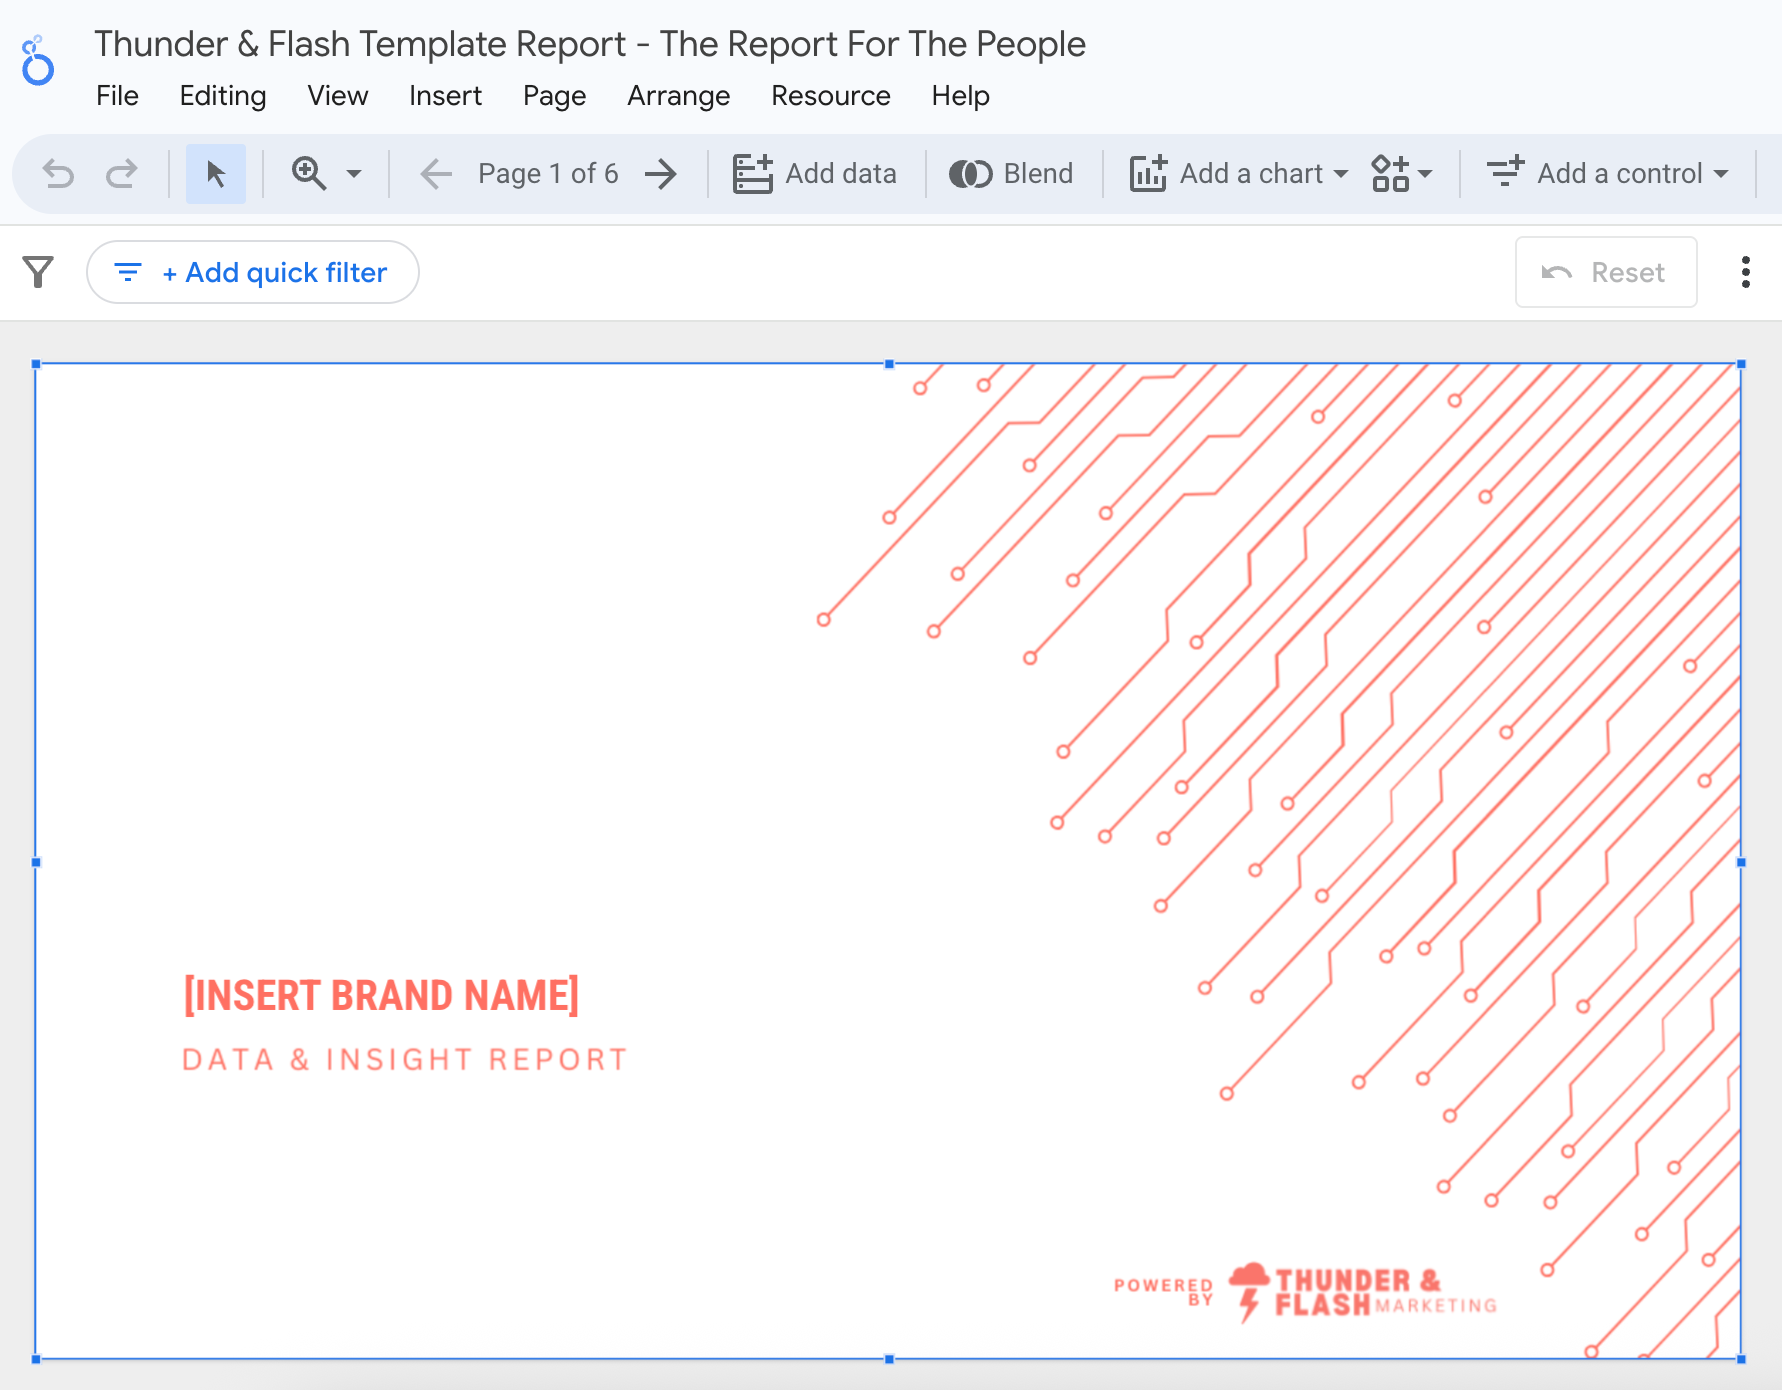
Firstly, you'll want to give your report a name and put your own business name on the front (after all, it's personal to you!)
- Right at the top of the window, you'll see its name 'Copy of Thunder & Flash Template Report - The Report For The People'. Change this to whatever you'd like your report to be called.
- On the front page, click where it says [INSERT BRAND NAME] and type in your business name.
Tip: Make sure you're in the editing window, and not the view window. You'll know if you're in the view window, because you'll see the following top right, and you'll just need to click 'edit':

Setting the date range
Your new report works in 'real time' - constantly fed by data from your Google Analytics. This also means that you can adjust the date range and manipulate the data in the report.
You can do this top right with the date selector:

The important data at a glance
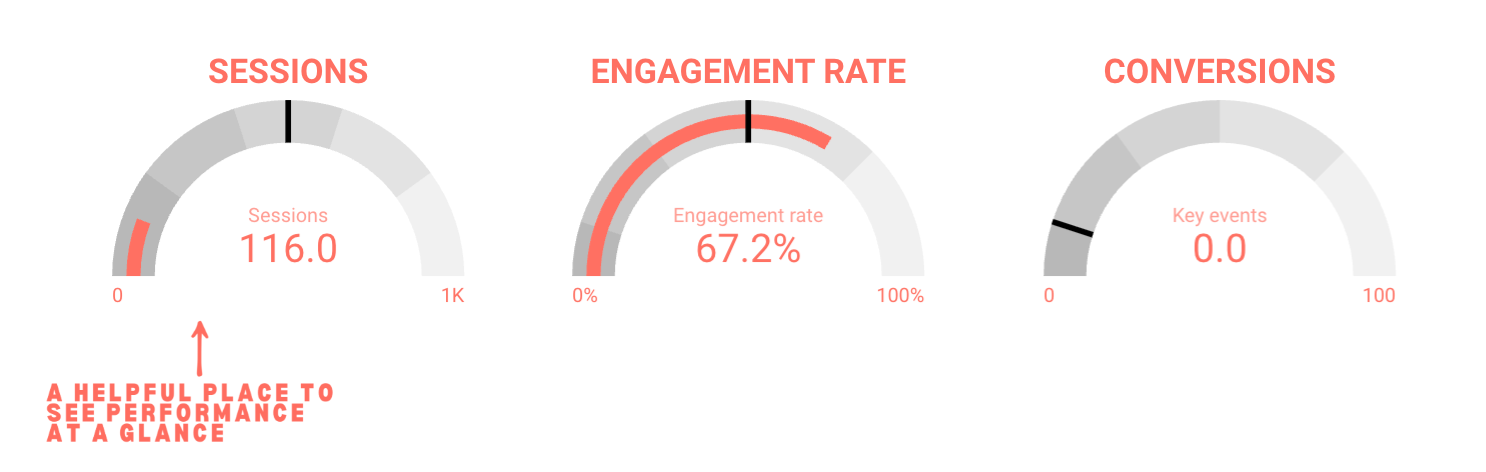
The report gives you what you need to know with as little hassle as possible. The first section highlights the three most important metrics on your website: traffic (measured in sessions), engagement rate and conversions. This lets you open the report and quickly see how things are going for any given period of time.
It looks like this:
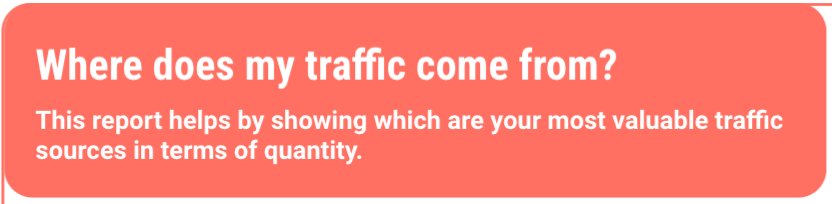
Report sections, leading with a purpose
Each section of the report is broken out by a purpose, explaining why the data in it is insightful and how it can be used.
They look like this:
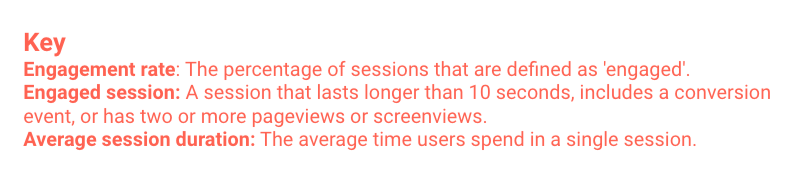
Guides to make sure you understand the measurement metrics
Next to the section introductions mentioned above, you'll find a key that outlines some of the language and names of the metrics and what they mean.
They look like this:
You're all set! Happy data gathering
With the above instructions, you should be well set up to start gathering data that actually means something to you and that you can use to make your marketing work harder for you.
Again, if you need any help with this,
give us a call and we'll help you for free!
If you don't have Google Analytics
You may have looked at this and realised that you don't have Google Analytics, or you're not sure if you do.
At Thunder & Flash Marketing, we're data & tracking specialists, so we are well-equipped to help you get set up with your data and tracking infrastructure. Get in touch with us, and we can chat about your needs.
You might find that this report doesn't quite give you the depth of data you need
This report is designed to give users the very most basic reporting data, but we understand that you may need more than this, or have a more bespoke infrastructure.
That's no problem, you can get in touch with us to discuss a more bespoke data and reporting solution.
Recent Posts